Motivation
Shiny is light-weighted web application, that seamlessly integrated with R. By using shiny, R users can quickly build prototype data product from their existing R models or analysis. In my experience of working with business users, they usually prefer a unified portal, where they can find all analytical solutions provided by data team. Developing a unified shiny application is more preferable, compared with many stand-alone small shiny apps, because the end users don’t have to bookmark the URLs for all applications and are able to access all apps with single login action. It helps to standardize the style and format as well, but on the other hand, it will be more difficult to code and maintain, especially using the default single app.R file structure. Therefore, I’m working on an extendable file structure to build the unified shiny portal.
Prerequisite
Packages
- shiny: use
navbarPageto assemble different shiny apps. - shinyjs: add powerful JavaScript capability to shiny, without prior knowledge of JavaScript.
- glue: advanced version of
paste, useful to format strings.
HTML
shiny already wraps common HTML tags into shiny tags object. Knowing common HTML tags, such as
- division tag:
div, tags$div() - paragraph tag:
p, tags$p() - thematic break tag:
hr, tags$hr()
will be sufficient for this post.
CSS
CSS controls the style of HTML elements by Class. This is preferable to create standardized web application, with no harm to your shiny app. CSS formatting file is located under ./www folder for shiny.
Shiny File Structure
In order to make it easy to unit test each individual shiny app, I created directories for each shiny app, where I also have an app.R for testing purpose.
app.Rin sub-folder: used for unit testing of this individual shiny app.app.Rin main-folder: used for integration testing of unified shiny app.tab.Rin sub-folder: used to create a list, that wraps theuiandserverof this shiny. After passing the unit test, it can be directly import to main shiny, for integration testing.global.R: used to define global settings, such as database connections, login credentials, page headers/footers.
main.css in www-folder: used to define the style of shiny app, by pointing to theme argument in navbarPage. In shiny, the images, css files or JavaScript codes are all located under www folder.
├── 00_tab_login # sub directory for login page
│   ├── app.R # shiny app for unit testing
│   └── tab.R # define a list, wrapping ui and server
├── 01_tab_dashboard_01 # sub directory for dashboard 01
│   ├── app.R
│   └── tab.R
├── 02_tab_dashboard_02 # sub directory for dashboard 02
│   ├── app.R
│   └── tab.R
├── app.R # main shiny app
├── global.R # define global settings
├── readme.md
└── www
    └── main.css # shiny css file

4 directories, 10 files
Using this file structure, I can easily add/remove certain shiny tab, without affecting other components.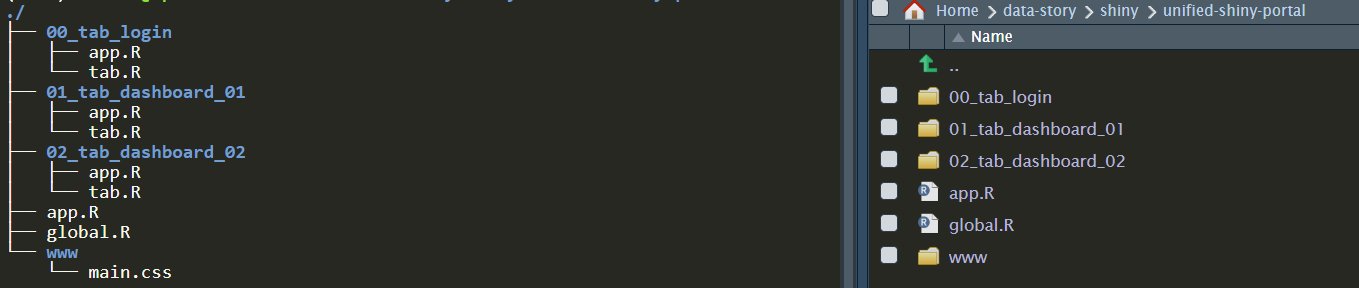
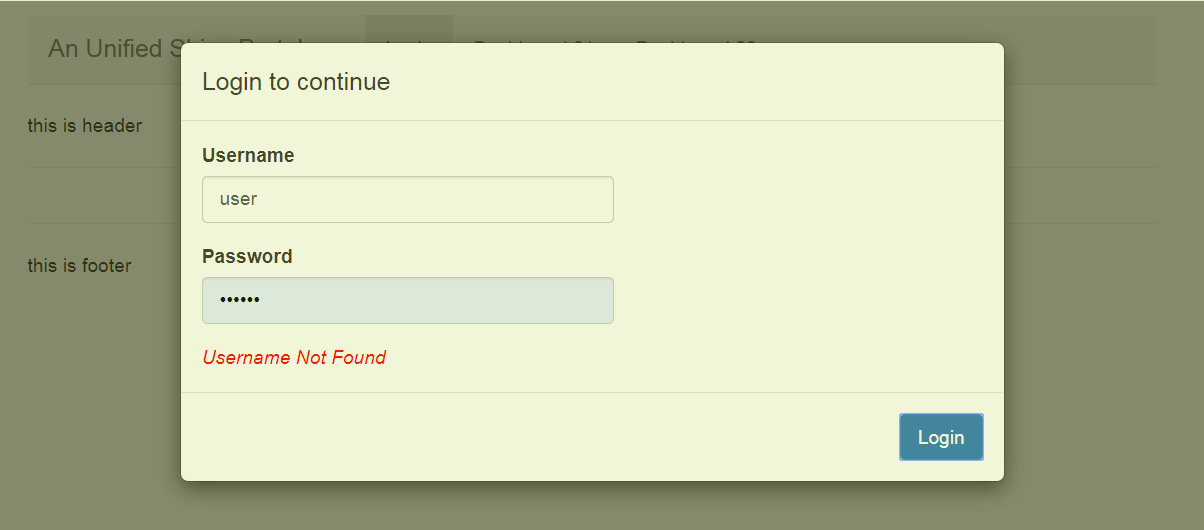
Login Page
First of all, let’s create a login page to secure our unified shiny app. shiny::modalDialog is used to create the pop-up dialog box, which stops the user accessing the content of shiny app. We just need to add one observeEventon login button to validate the user input. If user input is correct, remove the dialog box and show the welcome message, otherwise keep the dialog box and show the warning message.
Login Page – UI
The ui component is a tabPanel object, which just contains a hidden welcome message in a div tag.
idis set forshinyjsto locate JavaScript actions on it.classis set forCSSto identify the formatting styles.
login_dialog is another ui for the login dialog box, which allows user to input username and password. This UI will be controlled by server.
# define a list to wrap ui/server for login tab
tab_login <- list()

# define ui as tabPanel,
# so that it can be easily added to navbarPage of main shiny program
tab_login$ui <- tabPanel(
  title = 'Login', # name of the tab
  # hide the welcome message at the first place
  shinyjs::hidden(tags$div(
    id = 'tab_login.welcome_div',
    class = 'login-text',
    textOutput('tab_login.welcome_text', container = tags$h2))
  )
)

# define the ui of the login dialog box
# will used later in server part
login_dialog <- modalDialog(
  title = 'Login to continue',
  footer = actionButton('tab_login.login','Login'),
  textInput('tab_login.username','Username'),
  passwordInput('tab_login.password','Password'),
  tags$div(class = 'warn-text',textOutput('tab_login.login_msg'))
)
Login Page – Server
server component is a function of input,output or session (usually optional), that takes input generated by user and render the changes to output. (Note: user.access is a R list, generated from global.R)
# define the backend of login tab
tab_login$server <- function(input, output) {

  # show login dialog box when initiated
  showModal(login_dialog)

  observeEvent(input$tab_login.login, {
    username <- input$tab_login.username
    password <- input$tab_login.password

    # validate login credentials
    if(username %in% names(user.access)) {
      if(password == user.access[[username]]) {
        # succesfully log in
        removeModal() # remove login dialog
        output$tab_login.welcome_text <- renderText(glue('welcome, {username}'))
        shinyjs::show('tab_login.welcome_div') # show welcome message
      } else {
        # password incorrect, show the warning message
        # warning message disappear in 1 sec
        output$tab_login.login_msg <- renderText('Incorrect Password')
        shinyjs::show('tab_login.login_msg')
        shinyjs::delay(1000, hide('tab_login.login_msg'))
      }
    } else {
      # username not found, show the warning message
      # warning message disappear in 1 sec
      output$tab_login.login_msg <- renderText('Username Not Found')
      shinyjs::show('tab_login.login_msg')
      shinyjs::delay(1000, hide('tab_login.login_msg'))
    }
  })
}
Component Testing
After defined ui and server in tab.R, we now are ready to do the unit testing for shiny login page.
- set the working directory to the sub-folder.
setwd('./00_tab_login') - create
app.Ras follow, by assigning theuiandserverfromtab.R
library(shiny)
library(shinyjs)
library(glue)

source('tab.R') # load tab_login ui/server

ui <- navbarPage(
  title = 'Login',
  selected = 'Login',
  useShinyjs(), # initiate javascript
  tab_login$ui # append defined ui
)

server <- tab_login$server # assign defined server

shinyApp(ui = ui, server = server)
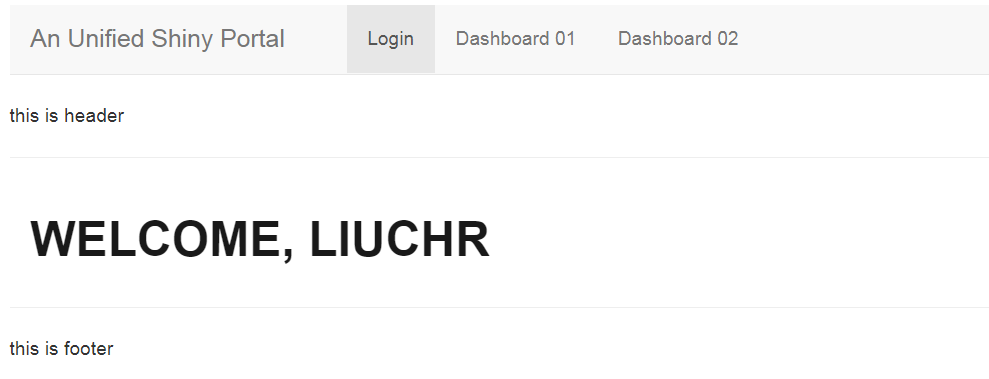
The tested login page
When successfully login, the page should be shown like this:
Integration Testing
After login page is tested, I also created two dummy dashboards dashboard 01and dashboard 02.
Similar to 00_tab_login, 01_tab_dashboard_01 and 02_tab_dashboard_02 are structured with tab.R and app.R.
01_tab_dashboard_01: histgram of normal distribution with sample size N (code details)02_tab_dashboard_02: estimation of pi using monte carlo simulation (code details)
After component testing of each shiny app is done, we can now put all shiny tabs together to form the unified shiny portal.
library(shiny)
library(shinyjs)
library(glue)

# load global parameters (DB connections, login credentials, etc)
source('global.R')
# load ui/server from each tab
source('./00_tab_login/tab.R')
source('./01_tab_dashboard_01/tab.R')
source('./02_tab_dashboard_02/tab.R')

app.title <- 'A Unified Shiny Portal'

ui <- navbarPage(
  title = app.title,
  id = 'tabs',
  selected = 'Login',
  theme = 'main.css', # defined in www/main.css
  header = header, # defined in global.R
  footer = footer, # defined in global.R
  # initiate javascript
  useShinyjs(),
  # ui for login page
  tab_login$ui,
  # ui for dashboard_01
  tab_01$ui,
  # ui for dashboard_02
  tab_02$ui
)

server <- function(input, output) {

  # load login page server
  tab_login$server(input, output)
  # load server of dashboard_01
  tab_01$server(input, output)
  # load server of dashboard_02
  tab_02$server(input, output)
}

# Run the application
shinyApp(ui = ui, server = server)
the final dashboard 01 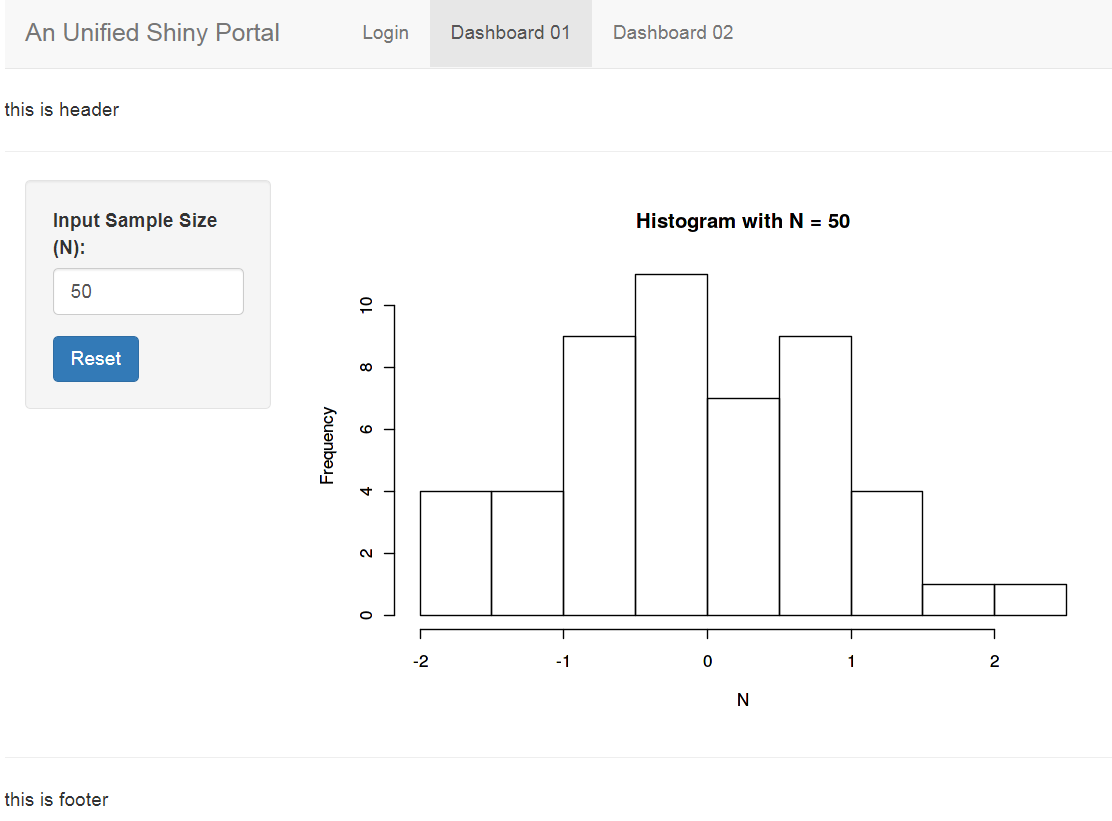
the final dashboard 02 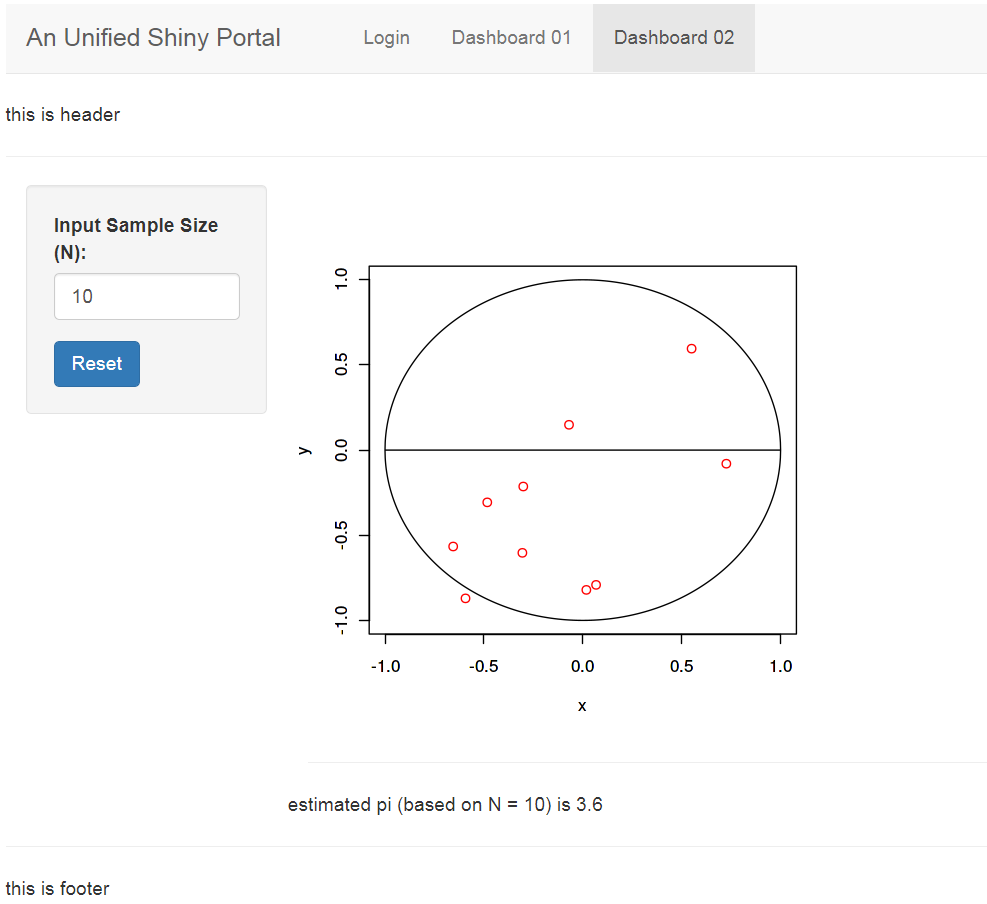
Conclusion
In summary, in order to build a unified shiny portal:
Login Page
- use
shiny::modalDialogto create dialog box for login page - use
shiny::showModal,shiny::removeModal,shinyjsto control the dialog box.
Extendable Shiny Tabs
- create separate folders for shiny tabs, which consists of
tab.Rdefininguiandserverandapp.Rdefining code for component testing. - load pairs of
uiandserverfrom each tab inapp.Rof main shiny page - test, test and test
Complete Unified Shiny Portal
shiny app on shinyapps.io
github repo
login credential ( username: liuchr, password: 123456 )